A hefty report is the standard outcome when a site is investigated for soil and water contaminants. Unless you’re a geological specialist, reading it through is not only time-consuming. There’s also a risk that you’ll be little the wiser by the end of it – and far from ready to make a decision on what to do next.
A few years ago, we decided to change that by introducing data visualization. After trying some of the software solutions available on the market, we started work on developing our own program, tailored to the needs of environmental asset management.
An overview at a glance
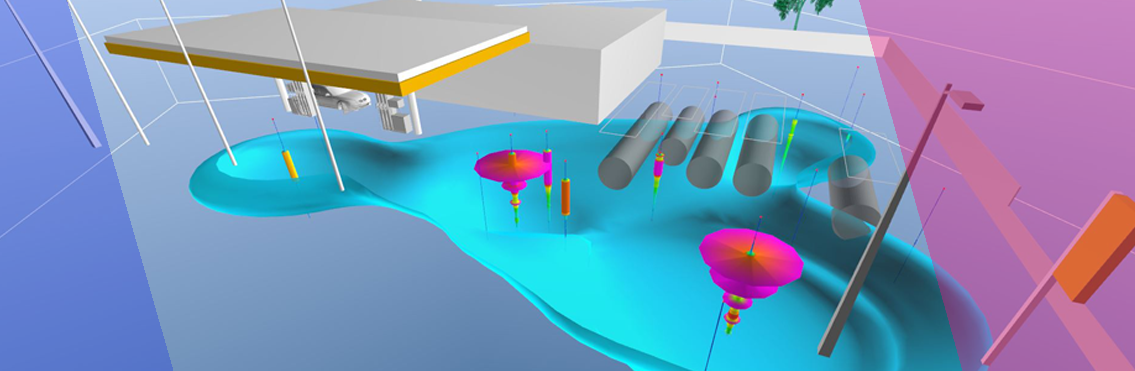
The result is the 3D modeling tool we call Ejlskov Studio. Its purpose is to build an accurate 3D illustration of the contaminated area of individual sites. Unlike a written report, this shows at a glance the breadth and depth of the contamination. The tool can produce a site model based on pre-existing and new data. Varying color intensities depict the concentration of contaminants across the area.
Extracting information from data
Here at Ejlskov, our approach is to use our MIP probing system to screen the site and gain an overview of the extent of the contamination – a task that takes a few days. This serves as a guide when taking the soil samples that tell us more about the contaminants, their concentration and the type of soil they are in. The 3D model takes shape dynamically as site data becomes available. Because screening and soil analyses cost money, it is important that our data-processing software adds as much value to the data as possible by extracting maximum information. Boosted by high-resolution data from physical site investigations, the model facilitates the design of a detailed remediation plan for removing soil and groundwater contaminants.
Contaminants in context
Today, the 3D models created by Ejlskov Studio enable well-informed decision-making. Most importantly, they show the contaminated area in context, visualizing tanks and other installations above and below ground. Development of our software is ongoing. In the future, we expect to visualize even more of the valuable information our soil data provides. That will make the process of managing, monitoring and eliminating site contaminants even easier to follow and understand – with far fewer of those complicated, technical reports.